Datalab: A unified audit to detect all kinds of issues in data and labels#
Cleanlab offers a Datalab object that can identify various issues in your machine learning datasets, such as noisy labels, outliers, (near) duplicates, drift, and other types of problems common in real-world data. These data issues may negatively impact models if not addressed. Datalab utilizes any ML model you have already trained for your data to diagnose these issues, it only requires access to either: (probabilistic) predictions from your model or its learned representations of the
data.
Overview of what we’ll do in this tutorial:
Compute out-of-sample predicted probabilities for a sample dataset using cross-validation.
Use
Datalabto identify issues such as noisy labels, outliers, (near) duplicates, and other types of problemsView the issue summaries and other information about our sample dataset
You can easily replace our demo dataset with your own image/text/tabular/audio/etc dataset, and then run the same code to discover what sort of issues lurk within it!
Quickstart
Already have (out-of-sample) pred_probs from a model trained on an existing set of labels? Maybe you also have some numeric features (or model embeddings of data)? Run the code below to examine your dataset for multiple types of issues.
from cleanlab import Datalab

lab = Datalab(data=your_dataset, label_name="column_name_of_labels")
lab.find_issues(features=your_feature_matrix, pred_probs=your_pred_probs)

lab.report()
1. Install and import required dependencies#
Datalab has additional dependencies that are not included in the standard installation of cleanlab.
You can use pip to install all packages required for this tutorial as follows:
!pip install matplotlib
!pip install "cleanlab[datalab]"

# Make sure to install the version corresponding to this tutorial
# E.g. if viewing master branch documentation:
#     !pip install git+https://github.com/cleanlab/cleanlab.git
[2]:
import numpy as np
import pandas as pd
from sklearn.linear_model import LogisticRegression
from sklearn.model_selection import cross_val_predict

from cleanlab import Datalab
2. Create and load the data (can skip these details)#
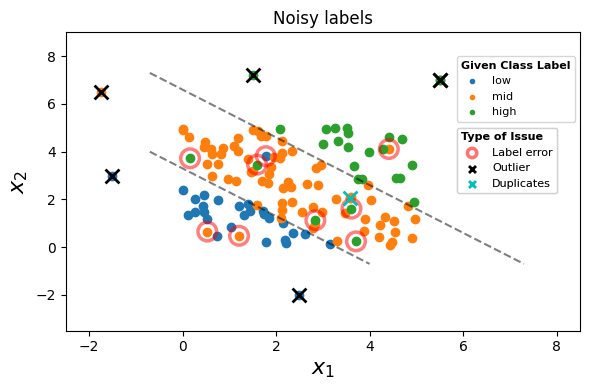
We’ll load a toy classification dataset for this tutorial. The dataset has two numerical features and a label column with three possible classes. Each example is classified as either: low, mid or high.
See the code for data generation. (click to expand)
# Note: This pulldown content is for docs.cleanlab.ai, if running on local Jupyter or Colab, please ignore it.

from sklearn.model_selection import train_test_split
from cleanlab.benchmarking.noise_generation import (
    generate_noise_matrix_from_trace,
    generate_noisy_labels,
)

SEED = 123
np.random.seed(SEED)

BINS = {
    "low": [-np.inf, 3.3],
    "mid": [3.3, 6.6],
    "high": [6.6, +np.inf],
}

BINS_MAP = {
    "low": 0,
    "mid": 1,
    "high": 2,
}


def create_data():

    X = np.random.rand(250, 2) * 5
    y = np.sum(X, axis=1)
    # Map y to bins based on the BINS dict
    y_bin = np.array([k for y_i in y for k, v in BINS.items() if v[0] <= y_i < v[1]])
    y_bin_idx = np.array([BINS_MAP[k] for k in y_bin])

    # Split into train and test
    X_train, X_test, y_train, y_test, y_train_idx, y_test_idx = train_test_split(
        X, y_bin, y_bin_idx, test_size=0.5, random_state=SEED
    )

    # Add several (5) out-of-distribution points. Sliding them along the decision boundaries
    # to make them look like they are out-of-frame
    X_out = np.array(
        [
            [-1.5, 3.0],
            [-1.75, 6.5],
            [1.5, 7.2],
            [2.5, -2.0],
            [5.5, 7.0],
        ]
    )
    # Add a near duplicate point to the last outlier, with some tiny noise added
    near_duplicate = X_out[-1:] + np.random.rand(1, 2) * 1e-6
    X_out = np.concatenate([X_out, near_duplicate])

    y_out = np.sum(X_out, axis=1)
    y_out_bin = np.array([k for y_i in y_out for k, v in BINS.items() if v[0] <= y_i < v[1]])
    y_out_bin_idx = np.array([BINS_MAP[k] for k in y_out_bin])

    # Add to train
    X_train = np.concatenate([X_train, X_out])
    y_train = np.concatenate([y_train, y_out])
    y_train_idx = np.concatenate([y_train_idx, y_out_bin_idx])

    # Add an exact duplicate example to the training set
    exact_duplicate_idx = np.random.randint(0, len(X_train))
    X_duplicate = X_train[exact_duplicate_idx, None]
    y_duplicate = y_train[exact_duplicate_idx, None]
    y_duplicate_idx = y_train_idx[exact_duplicate_idx, None]

    # Add to train
    X_train = np.concatenate([X_train, X_duplicate])
    y_train = np.concatenate([y_train, y_duplicate])
    y_train_idx = np.concatenate([y_train_idx, y_duplicate_idx])

    py = np.bincount(y_train_idx) / float(len(y_train_idx))
    m = len(BINS)

    noise_matrix = generate_noise_matrix_from_trace(
        m,
        trace=0.9 * m,
        py=py,
        valid_noise_matrix=True,
        seed=SEED,
    )

    noisy_labels_idx = generate_noisy_labels(y_train_idx, noise_matrix)
    noisy_labels = np.array([list(BINS_MAP.keys())[i] for i in noisy_labels_idx])

    return X_train, y_train_idx, noisy_labels, noisy_labels_idx, X_out, X_duplicate
[4]:
X_train, y_train_idx, noisy_labels, noisy_labels_idx, X_out, X_duplicate = create_data()
We make a scatter plot of the features, with a color corresponding to the observed labels. Incorrect given labels are highlighted in red if they do not match the true label, outliers highlighted with an a black cross, and duplicates highlighted with a cyan cross.
See the code to visualize the data. (click to expand)
# Note: This pulldown content is for docs.cleanlab.ai, if running on local Jupyter or Colab, please ignore it.

import matplotlib.pyplot as plt

def plot_data(X_train, y_train_idx, noisy_labels_idx, X_out, X_duplicate):
    # Plot data with clean labels and noisy labels, use BINS_MAP for the legend
    fig, ax = plt.subplots(figsize=(8, 6.5))

    low = ax.scatter(X_train[noisy_labels_idx == 0, 0], X_train[noisy_labels_idx == 0, 1], label="low")
    mid = ax.scatter(X_train[noisy_labels_idx == 1, 0], X_train[noisy_labels_idx == 1, 1], label="mid")
    high = ax.scatter(X_train[noisy_labels_idx == 2, 0], X_train[noisy_labels_idx == 2, 1], label="high")

    ax.set_title("Noisy labels")
    ax.set_xlabel(r"$x_1$", fontsize=16)
    ax.set_ylabel(r"$x_2$", fontsize=16)

    # Plot true boundaries (x+y=3.3, x+y=6.6)
    ax.set_xlim(-3.5, 9.0)
    ax.set_ylim(-3.5, 9.0)
    ax.plot([-0.7, 4.0], [4.0, -0.7], color="k", linestyle="--", alpha=0.5)
    ax.plot([-0.7, 7.3], [7.3, -0.7], color="k", linestyle="--", alpha=0.5)

    # Draw red circles around the points that are misclassified (i.e. the points that are in the wrong bin)
    for i, (X, y) in enumerate(zip([X_train, X_train], [y_train_idx, noisy_labels_idx])):
        for j, (k, v) in enumerate(BINS_MAP.items()):
            label_err = ax.scatter(
                X[(y == v) & (y != y_train_idx), 0],
                X[(y == v) & (y != y_train_idx), 1],
                s=180,
                marker="o",
                facecolor="none",
                edgecolors="red",
                linewidths=2.5,
                alpha=0.5,
                label="Label error",
            )


    outlier = ax.scatter(X_out[:, 0], X_out[:, 1], color="k", marker="x", s=100, linewidth=2, label="Outlier")

    # Plot the exact duplicate
    dups = ax.scatter(
        X_duplicate[:, 0],
        X_duplicate[:, 1],
        color="c",
        marker="x",
        s=100,
        linewidth=2,
        label="Duplicates",
    )

    first_legend = ax.legend(handles=[low, mid, high], loc=[0.75, 0.7], title="Given Class Label", alignment="left", title_fontproperties={"weight":"semibold"})
    second_legend = ax.legend(handles=[label_err, outlier, dups], loc=[0.75, 0.45], title="Type of Issue", alignment="left", title_fontproperties={"weight":"semibold"})

    ax = plt.gca().add_artist(first_legend)
    ax = plt.gca().add_artist(second_legend)
    plt.tight_layout()
[6]:
plot_data(X_train, y_train_idx, noisy_labels_idx, X_out, X_duplicate)
In real-world scenarios, you won’t know the true labels or the distribution of the features, so we won’t use these in this tutorial, except for evaluation purposes.
Datalab has several ways of loading the data. In this case, we’ll simply wrap the training features and noisy labels in a dictionary so that we can pass it to Datalab.
[7]:
data = {"X": X_train, "y": noisy_labels}
Other supported data formats for Datalab include: HuggingFace Datasets and pandas DataFrame. Datalab works across most data modalities (image, text, tabular, audio, etc). It is intended to find issues that commonly occur in datasets for which you have trained a supervised ML model, regardless of the type of data.
Currently, pandas DataFrames that contain categorical columns might cause some issues when instantiating the Datalab object, so it is recommended to ensure that your DataFrame does not contain any categorical columns, or use other data formats (eg. python dictionary, HuggingFace Datasets) to pass in your data.
3. Get out-of-sample predicted probabilities from a classifier#
To detect certain types of issues in classification data (e.g. label errors), Datalab relies on predicted class probabilities from a trained model. Ideally, the prediction for each example should be out-of-sample (to avoid overfitting), coming from a copy of the model that was not trained on this example.
This tutorial uses a simple logistic regression model and the cross_val_predict() function from scikit-learn to generate out-of-sample predicted class probabilities for every example in the training set. You can replace this with any other classifier model and train it with cross-validation to get out-of-sample predictions. Make sure that the columns of your pred_probs are properly ordered with respect to the ordering of classes, which for Datalab is: lexicographically sorted by class
name.
[8]:
model = LogisticRegression()
pred_probs = cross_val_predict(
    estimator=model, X=data["X"], y=data["y"], cv=5, method="predict_proba"
)
4. Use Datalab to find issues in the dataset#
We create a Datalab object from the dataset, also providing the name of the label column in the dataset. Only instantiate one Datalab object per dataset, and note that only classification datasets are supported for now.
All that is need to audit your data is to call find_issues(). This method accepts various inputs like: predicted class probabilities, numeric feature representations of the data. The more information you provide here, the more thoroughly Datalab will audit your data! Note that features should be some numeric representation of each example, either obtained through preprocessing transformation of your raw data or embeddings from a (pre)trained model. In this case, our data is already
entirely numeric so we just provide the features directly.
[9]:
lab = Datalab(data, label_name="y")
lab.find_issues(pred_probs=pred_probs, features=data["X"])
Finding null issues ...
Finding label issues ...
Finding outlier issues ...
Finding near_duplicate issues ...
Finding non_iid issues ...
Finding class_imbalance issues ...
Finding underperforming_group issues ...

Audit complete. 30 issues found in the dataset.
Now let’s review the results of this audit using report(). This provides a high-level summary of each type of issue found in the dataset.
[10]:
lab.report()
Dataset Information: num_examples: 132, num_classes: 4

Here is a summary of various issues found in your data:

     issue_type  num_issues
          label          17
        outlier           6
 near_duplicate           4
class_imbalance           3

Learn about each issue: https://docs.cleanlab.ai/stable/cleanlab/datalab/guide/issue_type_description.html
See which examples in your dataset exhibit each issue via: `datalab.get_issues(<ISSUE_NAME>)`

Data indices corresponding to top examples of each issue are shown below.


----------------------- label issues -----------------------

About this issue:
        Examples whose given label is estimated to be potentially incorrect
    (e.g. due to annotation error) are flagged as having label issues.


Number of examples with this issue: 17
Overall dataset quality in terms of this issue: 0.8561

Examples representing most severe instances of this issue:
     is_label_issue  label_score given_label predicted_label
77            False     0.001908         max             mid
58            False     0.003564         max            high
8             False     0.007331         max             mid
7              True     0.008963         low             mid
120            True     0.009664        high             mid


---------------------- outlier issues ----------------------

About this issue:
        Examples that are very different from the rest of the dataset
    (i.e. potentially out-of-distribution or rare/anomalous instances).


Number of examples with this issue: 6
Overall dataset quality in terms of this issue: 0.3558

Examples representing most severe instances of this issue:
     is_outlier_issue  outlier_score
126              True       0.006636
130              True       0.012571
129              True       0.012571
127              True       0.014909
128              True       0.017443


------------------ near_duplicate issues -------------------

About this issue:
        A (near) duplicate issue refers to two or more examples in
    a dataset that are extremely similar to each other, relative
    to the rest of the dataset.  The examples flagged with this issue
    may be exactly duplicated, or lie atypically close together when
    represented as vectors (i.e. feature embeddings).


Number of examples with this issue: 4
Overall dataset quality in terms of this issue: 0.6160

Examples representing most severe instances of this issue:
     is_near_duplicate_issue  near_duplicate_score near_duplicate_sets  distance_to_nearest_neighbor
131                     True              0.000000               [123]                  0.000000e+00
123                     True              0.000000               [131]                  0.000000e+00
129                     True              0.000002               [130]                  4.463180e-07
130                     True              0.000002               [129]                  4.463180e-07
51                     False              0.161148                  []                  3.859087e-02


------------------ class_imbalance issues ------------------

About this issue:
        Examples belonging to the most under-represented class in the dataset.

Number of examples with this issue: 3
Overall dataset quality in terms of this issue: 0.0227

Examples representing most severe instances of this issue:
    is_class_imbalance_issue  class_imbalance_score given_label
8                       True               0.022727         max
77                      True               0.022727         max
58                      True               0.022727         max
86                     False               1.000000         mid
87                     False               1.000000         mid

Additional Information:
Rarest Class: max
5. Learn more about the issues in your dataset#
Datalab detects all sorts of issues in a dataset and what to do with the findings will vary case-by-case.
To conceptually understand how each type of issue is defined and what it means if detected in your data, check out the Issue Type Descriptions page. The Datalab Issue Types page also lists additional types of issues that Datalab.find_issues() can detect, as well as optional parameters you can specify for greater control over how your data are
checked.
Datalab offers several methods to understand more details about a particular issue in your dataset. The get_issue_summary() method fetches summary statistics regarding how severe each type of issue is overall across the whole dataset.
[11]:
lab.get_issue_summary()
[11]:
| issue_type | score | num_issues | |
|---|---|---|---|
| 0 | null | 1.000000 | 0 |
| 1 | label | 0.856061 | 17 |
| 2 | outlier | 0.355772 | 6 |
| 3 | near_duplicate | 0.616034 | 4 |
| 4 | non_iid | 0.821750 | 0 |
| 5 | class_imbalance | 0.022727 | 3 |
| 6 | underperforming_group | 0.926818 | 0 |
In the returned summary DataFrame: LOWER score values indicate types of issues that are MORE severe overall across the dataset (lower-quality data in terms of this issue), HIGHER num_issues values indicate types of issues that are MORE severe overall across the dataset (more datapoints appear to exhibit this issue).
We can also only request the summary for a particular type of issue.
[12]:
lab.get_issue_summary("label")
[12]:
| issue_type | score | num_issues | |
|---|---|---|---|
| 0 | label | 0.856061 | 17 |
The get_issues() method returns information for each individual example in the dataset including: whether or not it is plagued by this issue (Boolean), as well as a quality score (numeric value betweeen 0 to 1) quantifying how severe this issue appears to be for this particular example.
[13]:
lab.get_issues().head()
[13]:
| is_null_issue | null_score | is_label_issue | label_score | is_outlier_issue | outlier_score | is_near_duplicate_issue | near_duplicate_score | is_non_iid_issue | non_iid_score | is_class_imbalance_issue | class_imbalance_score | is_underperforming_group_issue | underperforming_group_score | |
|---|---|---|---|---|---|---|---|---|---|---|---|---|---|---|
| 0 | False | 1.0 | False | 0.859131 | False | 0.417707 | False | 0.664083 | False | 0.970324 | False | 1.0 | False | 1.000000 |
| 1 | False | 1.0 | False | 0.816953 | False | 0.375317 | False | 0.641516 | False | 0.890575 | False | 1.0 | False | 0.910232 |
| 2 | False | 1.0 | False | 0.531021 | False | 0.460593 | False | 0.601188 | False | 0.826147 | False | 1.0 | False | 0.910232 |
| 3 | False | 1.0 | False | 0.752808 | False | 0.321635 | False | 0.562539 | False | 0.948362 | False | 1.0 | False | 0.890169 |
| 4 | False | 1.0 | True | 0.090243 | False | 0.472909 | False | 0.746763 | False | 0.878267 | False | 1.0 | False | 1.000000 |
Each example receives a separate quality score for each issue type (eg. outlier_score is the quality score for the outlier issue type, quantifying how typical each datapoint appears to be). LOWER scores indicate MORE severe instances of the issue, so the most-concerning datapoints have the lowest quality scores. Sort by these scores to see the most-concerning examples in your dataset for each type of issue. The quality scores are directly comparable between examples/datasets, but
not across different issue types.
Similar to above, we can pass the type of issue as a argument to get_issues() to get the information for one particular type of issue. As an example, let’s see the examples identified as having the most severe label issues:
[14]:
examples_w_issue = (
    lab.get_issues("label")
    .query("is_label_issue")
    .sort_values("label_score")
)

examples_w_issue.head()
[14]:
| is_label_issue | label_score | given_label | predicted_label | |
|---|---|---|---|---|
| 7 | True | 0.008963 | low | mid |
| 120 | True | 0.009664 | high | mid |
| 40 | True | 0.013445 | mid | low |
| 107 | True | 0.025184 | high | mid |
| 53 | True | 0.026376 | high | mid |
Inspecting the labels for some of these top-ranked examples, we find their given label was indeed incorrect.
Get additional information#
Miscellaneous additional information (statistics, intermediate results, etc) related to a particular issue type can be accessed via get_info(issue_name).
[15]:
label_issues_info = lab.get_info("label")
label_issues_info["classes_by_label_quality"]
[15]:
| Class Name | Class Index | Label Issues | Inverse Label Issues | Label Noise | Inverse Label Noise | Label Quality Score | |
|---|---|---|---|---|---|---|---|
| 0 | low | 1 | 12 | 2 | 0.428571 | 0.111111 | 0.571429 |
| 1 | high | 0 | 11 | 2 | 0.407407 | 0.111111 | 0.592593 |
| 2 | mid | 3 | 25 | 5 | 0.337838 | 0.092593 | 0.662162 |
| 3 | max | 2 | 1 | 40 | 0.333333 | 0.952381 | 0.666667 |
This portion of the info shows overall label quality summaries of all examples annotated as a particular class (e.g. the Label Issues column is the estimated number of examples labeled as this class that should actually have a different label). To learn more about this, see the documentation for the cleanlab.dataset.rank_classes_by_label_quality method.
You can view all sorts of information regarding your dataset using the get_info() method with no arguments passed. This is not printed here as it returns a huge dictionary but feel free to check it out yourself! Don’t worry if you don’t understand all of the miscellaneous information in this info dictionary, none of it is critical to diagnose the issues in your dataset. Understanding miscellaneous info may require reading the documentation of the miscellaneous cleanlab functions which
computed it.
Near duplicate issues#
Let’s also inspect the examples flagged as (near) duplicates. For each such example, the near_duplicate_sets column below indicates which other examples in the dataset are highly similar to it (this value is empty for examples not flagged as nearly duplicated). The near_duplicate_score quantifies how similar each example is to its nearest neighbor in the dataset.
[16]:
lab.get_issues("near_duplicate").query("is_near_duplicate_issue").sort_values("near_duplicate_score")
[16]:
| is_near_duplicate_issue | near_duplicate_score | near_duplicate_sets | distance_to_nearest_neighbor | |
|---|---|---|---|---|
| 123 | True | 0.000000 | [131] | 0.000000e+00 |
| 131 | True | 0.000000 | [123] | 0.000000e+00 |
| 129 | True | 0.000002 | [130] | 4.463180e-07 |
| 130 | True | 0.000002 | [129] | 4.463180e-07 |
Learn more about handling near duplicates detected in a dataset from the FAQ.
Other issues detected in this tutorial dataset include outliers and class imbalance, see the Issue Type Descriptions for more information. Datalab makes it very easy to check your datasets for all sorts of issues that are important to deal with for training robust models. The inputs it uses to detect issues can come from any model you have trained (the better your model, the more accurate the issue detection will be).
To learn more, check out this example notebook (demonstrates Datalab applied to a real dataset) and the advanced Datalab tutorial (demonstrates configuration and customization options to exert greater control).