Datalab: Advanced workflows to audit your data#
Cleanlab offers a Datalab object to identify various issues in your machine learning datasets that may negatively impact models if not addressed. By default, Datalab can help you identify noisy labels, outliers, (near) duplicates, and other types of problems that commonly occur in real-world data.
Datalab performs these checks by utilizing the (probabilistic) predictions from any ML model that has already been trained or its learned representations of the data. Underneath the hood, this class calls all the appropriate cleanlab methods for your dataset and provided model outputs, in order to best audit the data and alert you of important issues. This makes it easy to apply many functionalities of this library all within a single line of code.
This tutorial will demonstrate some advanced functionalities of Datalab including:
Incremental issue search
Specifying nondefault arguments to issue checks
Save and load Datalab objects
Adding a custom IssueManager
If you are new to Datalab, check out this quickstart tutorial for a 5-min introduction!
Quickstart
Already have (out-of-sample) pred_probs from a model trained on an existing set of labels? Maybe you have some features as well? Run the code below to examine your dataset for multiple types of issues.
from cleanlab import Datalab

lab = Datalab(data=your_dataset, label_name="column_name_of_labels")
lab.find_issues(features=your_feature_matrix, pred_probs=your_pred_probs)

lab.report()
Install and import required dependencies#
Datalab has additional dependencies that are not included in the standard installation of cleanlab.
You can use pip to install all packages required for this tutorial as follows:
!pip install matplotlib
!pip install "cleanlab[datalab]"

# Make sure to install the version corresponding to this tutorial
# E.g. if viewing master branch documentation:
#     !pip install git+https://github.com/cleanlab/cleanlab.git
[2]:
import numpy as np
import pandas as pd
from sklearn.linear_model import LogisticRegression
from sklearn.model_selection import cross_val_predict

from cleanlab import Datalab
Create and load the data#
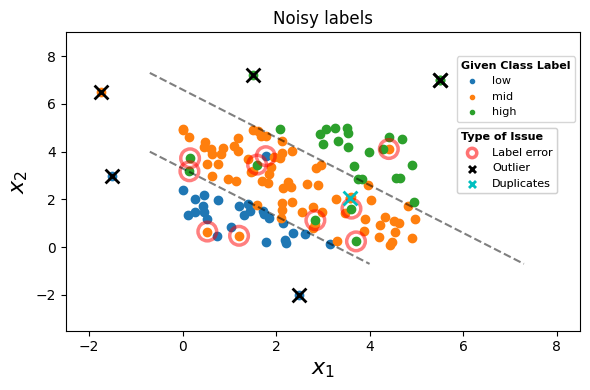
We’ll load a toy classification dataset for this tutorial. The dataset has two numerical features and a label column with three classes.
See the code for data generation. (click to expand)
# Note: This pulldown content is for docs.cleanlab.ai, if running on local Jupyter or Colab, please ignore it.

from sklearn.model_selection import train_test_split
from cleanlab.benchmarking.noise_generation import (
    generate_noise_matrix_from_trace,
    generate_noisy_labels,
)

SEED = 123
np.random.seed(SEED)

BINS = {
    "low": [-np.inf, 3.3],
    "mid": [3.3, 6.6],
    "high": [6.6, +np.inf],
}

BINS_MAP = {
    "low": 0,
    "mid": 1,
    "high": 2,
}


def create_data():

    X = np.random.rand(250, 2) * 5
    y = np.sum(X, axis=1)
    # Map y to bins based on the BINS dict
    y_bin = np.array([k for y_i in y for k, v in BINS.items() if v[0] <= y_i < v[1]])
    y_bin_idx = np.array([BINS_MAP[k] for k in y_bin])

    # Split into train and test
    X_train, X_test, y_train, y_test, y_train_idx, y_test_idx = train_test_split(
        X, y_bin, y_bin_idx, test_size=0.5, random_state=SEED
    )

    # Add several (5) out-of-distribution points. Sliding them along the decision boundaries
    # to make them look like they are out-of-frame
    X_out = np.array(
        [
            [-1.5, 3.0],
            [-1.75, 6.5],
            [1.5, 7.2],
            [2.5, -2.0],
            [5.5, 7.0],
        ]
    )
    # Add a near duplicate point to the last outlier, with some tiny noise added
    near_duplicate = X_out[-1:] + np.random.rand(1, 2) * 1e-6
    X_out = np.concatenate([X_out, near_duplicate])

    y_out = np.sum(X_out, axis=1)
    y_out_bin = np.array([k for y_i in y_out for k, v in BINS.items() if v[0] <= y_i < v[1]])
    y_out_bin_idx = np.array([BINS_MAP[k] for k in y_out_bin])

    # Add to train
    X_train = np.concatenate([X_train, X_out])
    y_train = np.concatenate([y_train, y_out])
    y_train_idx = np.concatenate([y_train_idx, y_out_bin_idx])

    # Add an exact duplicate example to the training set
    exact_duplicate_idx = np.random.randint(0, len(X_train))
    X_duplicate = X_train[exact_duplicate_idx, None]
    y_duplicate = y_train[exact_duplicate_idx, None]
    y_duplicate_idx = y_train_idx[exact_duplicate_idx, None]

    # Add to train
    X_train = np.concatenate([X_train, X_duplicate])
    y_train = np.concatenate([y_train, y_duplicate])
    y_train_idx = np.concatenate([y_train_idx, y_duplicate_idx])

    py = np.bincount(y_train_idx) / float(len(y_train_idx))
    m = len(BINS)

    noise_matrix = generate_noise_matrix_from_trace(
        m,
        trace=0.9 * m,
        py=py,
        valid_noise_matrix=True,
        seed=SEED,
    )

    noisy_labels_idx = generate_noisy_labels(y_train_idx, noise_matrix)
    noisy_labels = np.array([list(BINS_MAP.keys())[i] for i in noisy_labels_idx])

    return X_train, y_train_idx, noisy_labels, noisy_labels_idx, X_out, X_duplicate
[4]:
X_train, y_train_idx, noisy_labels, noisy_labels_idx, X_out, X_duplicate = create_data()
We make a scatter plot of the features, with a color corresponding to the observed labels. Incorrect given labels are highlighted in red if they do not match the true label, outliers highlighted with an a black cross, and duplicates highlighted with a cyan cross.
See the code to visualize the data. (click to expand)
# Note: This pulldown content is for docs.cleanlab.ai, if running on local Jupyter or Colab, please ignore it.

import matplotlib.pyplot as plt

def plot_data(X_train, y_train_idx, noisy_labels_idx, X_out, X_duplicate):
    # Plot data with clean labels and noisy labels, use BINS_MAP for the legend
    fig, ax = plt.subplots(figsize=(8, 6.5))

    low = ax.scatter(X_train[noisy_labels_idx == 0, 0], X_train[noisy_labels_idx == 0, 1], label="low")
    mid = ax.scatter(X_train[noisy_labels_idx == 1, 0], X_train[noisy_labels_idx == 1, 1], label="mid")
    high = ax.scatter(X_train[noisy_labels_idx == 2, 0], X_train[noisy_labels_idx == 2, 1], label="high")

    ax.set_title("Noisy labels")
    ax.set_xlabel(r"$x_1$", fontsize=16)
    ax.set_ylabel(r"$x_2$", fontsize=16)

    # Plot true boundaries (x+y=3.3, x+y=6.6)
    ax.set_xlim(-3.5, 9.0)
    ax.set_ylim(-3.5, 9.0)
    ax.plot([-0.7, 4.0], [4.0, -0.7], color="k", linestyle="--", alpha=0.5)
    ax.plot([-0.7, 7.3], [7.3, -0.7], color="k", linestyle="--", alpha=0.5)

    # Draw red circles around the points that are misclassified (i.e. the points that are in the wrong bin)
    for i, (X, y) in enumerate(zip([X_train, X_train], [y_train_idx, noisy_labels_idx])):
        for j, (k, v) in enumerate(BINS_MAP.items()):
            label_err = ax.scatter(
                X[(y == v) & (y != y_train_idx), 0],
                X[(y == v) & (y != y_train_idx), 1],
                s=180,
                marker="o",
                facecolor="none",
                edgecolors="red",
                linewidths=2.5,
                alpha=0.5,
                label="Label error",
            )


    outlier = ax.scatter(X_out[:, 0], X_out[:, 1], color="k", marker="x", s=100, linewidth=2, label="Outlier")

    # Plot the exact duplicate
    dups = ax.scatter(
        X_duplicate[:, 0],
        X_duplicate[:, 1],
        color="c",
        marker="x",
        s=100,
        linewidth=2,
        label="Duplicates",
    )

    first_legend = ax.legend(handles=[low, mid, high], loc=[0.75, 0.7], title="Given Class Label", alignment="left", title_fontproperties={"weight":"semibold"})
    second_legend = ax.legend(handles=[label_err, outlier, dups], loc=[0.75, 0.45], title="Type of Issue", alignment="left", title_fontproperties={"weight":"semibold"})

    ax = plt.gca().add_artist(first_legend)
    ax = plt.gca().add_artist(second_legend)
    plt.tight_layout()
[6]:
plot_data(X_train, y_train_idx, noisy_labels_idx, X_out, X_duplicate)
In real-world scenarios, you won’t know the true labels or the distribution of the features, so we won’t use these in this tutorial, except for evaluation purposes.
Get out-of-sample predicted probabilities from a classifier#
To detect certain types of issues in classification data (e.g. label errors), Datalab relies on predicted class probabilities from a trained model. Ideally, the prediction for each example should be out-of-sample (to avoid overfitting), coming from a copy of the model that was not trained on this example.
This tutorial uses a simple logistic regression model and the cross_val_predict() function from scikit-learn to generate out-of-sample predicted class probabilities for every example in the training set. You can replace this with any other classifier model and train it with cross-validation to get out-of-sample predictions. Make sure that the columns of your pred_probs are properly ordered with respect to the ordering of classes, which for Datalab is: lexicographically sorted by class
name.
[7]:
model = LogisticRegression()
pred_probs = cross_val_predict(
    estimator=model, X=X_train, y=noisy_labels, cv=5, method="predict_proba"
)
Instantiate Datalab object#
Here we instantiate the Datalab object that will be used in the remainder in the tutorial by passing in the data created above.
Datalab has several ways of loading the data. In this case, we’ll simply wrap the training features and noisy labels in a dictionary so that we can pass it to Datalab.
Other supported data formats for Datalab include: HuggingFace Datasets and pandas DataFrame. Datalab works across most data modalities (image, text, tabular, audio, etc). It is intended to find issues that commonly occur in datasets for which you have trained a supervised ML model, regardless of the type of data.
Currently, pandas DataFrames that contain categorical columns might cause some issues when instantiating the Datalab object, so it is recommended to ensure that your DataFrame does not contain any categorical columns, or use other data formats (eg. python dictionary, HuggingFace Datasets) to pass in your data.
[8]:
data = {"X": X_train, "y": noisy_labels}

lab = Datalab(data, label_name="y")
Functionality 1: Incremental issue search#
We can call find_issues multiple times on a Datalab object to detect issues one type at a time.
This is done via the issue_types argument which accepts a dictionary of issue types and any corresponding keyword arguments to specify nondefault keyword arguments to use for detecting each type of issues. In this first call, we only want to detect label issues, which are detected solely based on pred_probs, hence there is no need for us to pass in features here.
[9]:
lab.find_issues(pred_probs=pred_probs, issue_types={"label": {}})
lab.report()
Finding label issues ...

Audit complete. 11 issues found in the dataset.
Dataset Information: num_examples: 132, num_classes: 3

Here is a summary of various issues found in your data:

issue_type  num_issues
     label          11

Learn about each issue: https://docs.cleanlab.ai/stable/cleanlab/datalab/guide/issue_type_description.html
See which examples in your dataset exhibit each issue via: `datalab.get_issues(<ISSUE_NAME>)`

Data indices corresponding to top examples of each issue are shown below.


----------------------- label issues -----------------------

About this issue:
        Examples whose given label is estimated to be potentially incorrect
    (e.g. due to annotation error) are flagged as having label issues.


Number of examples with this issue: 11
Overall dataset quality in terms of this issue: 0.9318

Examples representing most severe instances of this issue:
     is_label_issue  label_score given_label predicted_label
77             True     0.006940        high             mid
7              True     0.007830         low             mid
40             True     0.014828         mid             low
107            True     0.021241        high             mid
120            True     0.026407        high             mid
We can check for additional types of issues with the same Datalab. Here, we would like to detect outliers and near duplicates which both utilize the features of the data.
Notice that this second call to find_issues() updates the output of report(), we can see the existing label issues detected alongside the new issues.
[10]:
lab.find_issues(features=data["X"], issue_types={"outlier": {}, "near_duplicate": {}})
lab.report()
Finding outlier issues ...
Finding near_duplicate issues ...

Audit complete. 21 issues found in the dataset.
Dataset Information: num_examples: 132, num_classes: 3

Here is a summary of various issues found in your data:

    issue_type  num_issues
         label          11
       outlier           6
near_duplicate           4

Learn about each issue: https://docs.cleanlab.ai/stable/cleanlab/datalab/guide/issue_type_description.html
See which examples in your dataset exhibit each issue via: `datalab.get_issues(<ISSUE_NAME>)`

Data indices corresponding to top examples of each issue are shown below.


----------------------- label issues -----------------------

About this issue:
        Examples whose given label is estimated to be potentially incorrect
    (e.g. due to annotation error) are flagged as having label issues.


Number of examples with this issue: 11
Overall dataset quality in terms of this issue: 0.9318

Examples representing most severe instances of this issue:
     is_label_issue  label_score given_label predicted_label
77             True     0.006940        high             mid
7              True     0.007830         low             mid
40             True     0.014828         mid             low
107            True     0.021241        high             mid
120            True     0.026407        high             mid


---------------------- outlier issues ----------------------

About this issue:
        Examples that are very different from the rest of the dataset
    (i.e. potentially out-of-distribution or rare/anomalous instances).


Number of examples with this issue: 6
Overall dataset quality in terms of this issue: 0.3558

Examples representing most severe instances of this issue:
     is_outlier_issue  outlier_score
126              True       0.006636
130              True       0.012571
129              True       0.012571
127              True       0.014909
128              True       0.017443


------------------ near_duplicate issues -------------------

About this issue:
        A (near) duplicate issue refers to two or more examples in
    a dataset that are extremely similar to each other, relative
    to the rest of the dataset.  The examples flagged with this issue
    may be exactly duplicated, or lie atypically close together when
    represented as vectors (i.e. feature embeddings).


Number of examples with this issue: 4
Overall dataset quality in terms of this issue: 0.6160

Examples representing most severe instances of this issue:
     is_near_duplicate_issue  near_duplicate_score near_duplicate_sets  distance_to_nearest_neighbor
131                     True              0.000000               [123]                  0.000000e+00
123                     True              0.000000               [131]                  0.000000e+00
129                     True              0.000002               [130]                  4.463180e-07
130                     True              0.000002               [129]                  4.463180e-07
51                     False              0.161148                  []                  3.859087e-02
Functionality 2: Specifying nondefault arguments#
We can also overwrite previously-executed checks for a type of issue. Here we re-run the detection of outliers, but specify that different non-default settings should be used (in this case, the number of neighbors k compared against to determine which datapoints are outliers). The results from this new detection will replace the original outlier detection results in the updated Datalab. You could similarly specify non-default settings for other issue types in the first call to
Datalab.find_issues().
[11]:
lab.find_issues(features=data["X"], issue_types={"outlier": {"k": 30}})
lab.report()
Finding outlier issues ...

Audit complete. 22 issues found in the dataset.
Dataset Information: num_examples: 132, num_classes: 3

Here is a summary of various issues found in your data:

    issue_type  num_issues
         label          11
       outlier           7
near_duplicate           4

Learn about each issue: https://docs.cleanlab.ai/stable/cleanlab/datalab/guide/issue_type_description.html
See which examples in your dataset exhibit each issue via: `datalab.get_issues(<ISSUE_NAME>)`

Data indices corresponding to top examples of each issue are shown below.


----------------------- label issues -----------------------

About this issue:
        Examples whose given label is estimated to be potentially incorrect
    (e.g. due to annotation error) are flagged as having label issues.


Number of examples with this issue: 11
Overall dataset quality in terms of this issue: 0.9318

Examples representing most severe instances of this issue:
     is_label_issue  label_score given_label predicted_label
77             True     0.006940        high             mid
7              True     0.007830         low             mid
40             True     0.014828         mid             low
107            True     0.021241        high             mid
120            True     0.026407        high             mid


---------------------- outlier issues ----------------------

About this issue:
        Examples that are very different from the rest of the dataset
    (i.e. potentially out-of-distribution or rare/anomalous instances).


Number of examples with this issue: 7
Overall dataset quality in terms of this issue: 0.3453

Examples representing most severe instances of this issue:
     is_outlier_issue  outlier_score
126              True       0.029542
130              True       0.031182
129              True       0.031182
128              True       0.057961
127              True       0.058244


------------------ near_duplicate issues -------------------

About this issue:
        A (near) duplicate issue refers to two or more examples in
    a dataset that are extremely similar to each other, relative
    to the rest of the dataset.  The examples flagged with this issue
    may be exactly duplicated, or lie atypically close together when
    represented as vectors (i.e. feature embeddings).


Number of examples with this issue: 4
Overall dataset quality in terms of this issue: 0.6160

Examples representing most severe instances of this issue:
     is_near_duplicate_issue  near_duplicate_score near_duplicate_sets  distance_to_nearest_neighbor
131                     True              0.000000               [123]                  0.000000e+00
123                     True              0.000000               [131]                  0.000000e+00
129                     True              0.000002               [130]                  4.463180e-07
130                     True              0.000002               [129]                  4.463180e-07
51                     False              0.161148                  []                  3.859087e-02
You can also increase the verbosity of the report to see additional information about the data issues and control how many top-ranked examples are shown for each issue.
[12]:
lab.report(num_examples=10, verbosity=2)
Dataset Information: num_examples: 132, num_classes: 3

Here is a summary of various issues found in your data:

    issue_type  num_issues
         label          11
       outlier           7
near_duplicate           4

Learn about each issue: https://docs.cleanlab.ai/stable/cleanlab/datalab/guide/issue_type_description.html
See which examples in your dataset exhibit each issue via: `datalab.get_issues(<ISSUE_NAME>)`

Data indices corresponding to top examples of each issue are shown below.


----------------------- label issues -----------------------

About this issue:
        Examples whose given label is estimated to be potentially incorrect
    (e.g. due to annotation error) are flagged as having label issues.


Number of examples with this issue: 11
Overall dataset quality in terms of this issue: 0.9318

Examples representing most severe instances of this issue:
     is_label_issue  label_score given_label predicted_label
77             True     0.006940        high             mid
7              True     0.007830         low             mid
40             True     0.014828         mid             low
107            True     0.021241        high             mid
120            True     0.026407        high             mid
54             True     0.039122         mid             low
53             True     0.044598        high             mid
105            True     0.105196         mid            high
4              True     0.133654        high             mid
43             True     0.168033        high             mid


---------------------- outlier issues ----------------------

About this issue:
        Examples that are very different from the rest of the dataset
    (i.e. potentially out-of-distribution or rare/anomalous instances).


Number of examples with this issue: 7
Overall dataset quality in terms of this issue: 0.3453

Examples representing most severe instances of this issue:
     is_outlier_issue  outlier_score
126              True       0.029542
130              True       0.031182
129              True       0.031182
128              True       0.057961
127              True       0.058244
125              True       0.101107
37               True       0.183382
109             False       0.209259
35              False       0.211042
5               False       0.221316

Additional Information:
average_ood_score: 0.34530442089193386


------------------ near_duplicate issues -------------------

About this issue:
        A (near) duplicate issue refers to two or more examples in
    a dataset that are extremely similar to each other, relative
    to the rest of the dataset.  The examples flagged with this issue
    may be exactly duplicated, or lie atypically close together when
    represented as vectors (i.e. feature embeddings).


Number of examples with this issue: 4
Overall dataset quality in terms of this issue: 0.6160

Examples representing most severe instances of this issue:
     is_near_duplicate_issue  near_duplicate_score near_duplicate_sets  distance_to_nearest_neighbor
131                     True              0.000000               [123]                  0.000000e+00
123                     True              0.000000               [131]                  0.000000e+00
129                     True              0.000002               [130]                  4.463180e-07
130                     True              0.000002               [129]                  4.463180e-07
51                     False              0.161148                  []                  3.859087e-02
52                     False              0.161148                  []                  3.859087e-02
5                      False              0.169820                  []                  4.087324e-02
89                     False              0.169820                  []                  4.087324e-02
92                     False              0.259024                  []                  6.583757e-02
91                     False              0.346458                  []                  9.341292e-02

Additional Information:
threshold: 0.13
Notice how the number of flagged outlier issues has changed after specfying different settings to use for outlier detection.
Functionality 3: Save and load Datalab objects#
A Datalab can be saved to a folder at a specified path. In a future Python process, this path can be used to load the Datalab from file back into memory. Your dataset is not saved as part of this process, so you’ll need to save/load it separately to keep working with it.
[13]:
path = "datalab-files"
lab.save(path, force=True)
Saved Datalab to folder: datalab-files
We can load a Datalab object we have on file and view the previously detected issues.
[14]:
new_lab = Datalab.load(path)
new_lab.report()
Datalab loaded from folder: datalab-files
Dataset Information: num_examples: 132, num_classes: 3

Here is a summary of various issues found in your data:

    issue_type  num_issues
         label          11
       outlier           7
near_duplicate           4

Learn about each issue: https://docs.cleanlab.ai/stable/cleanlab/datalab/guide/issue_type_description.html
See which examples in your dataset exhibit each issue via: `datalab.get_issues(<ISSUE_NAME>)`

Data indices corresponding to top examples of each issue are shown below.


----------------------- label issues -----------------------

About this issue:
        Examples whose given label is estimated to be potentially incorrect
    (e.g. due to annotation error) are flagged as having label issues.


Number of examples with this issue: 11
Overall dataset quality in terms of this issue: 0.9318

Examples representing most severe instances of this issue:
     is_label_issue  label_score given_label predicted_label
77             True     0.006940        high             mid
7              True     0.007830         low             mid
40             True     0.014828         mid             low
107            True     0.021241        high             mid
120            True     0.026407        high             mid


---------------------- outlier issues ----------------------

About this issue:
        Examples that are very different from the rest of the dataset
    (i.e. potentially out-of-distribution or rare/anomalous instances).


Number of examples with this issue: 7
Overall dataset quality in terms of this issue: 0.3453

Examples representing most severe instances of this issue:
     is_outlier_issue  outlier_score
126              True       0.029542
130              True       0.031182
129              True       0.031182
128              True       0.057961
127              True       0.058244


------------------ near_duplicate issues -------------------

About this issue:
        A (near) duplicate issue refers to two or more examples in
    a dataset that are extremely similar to each other, relative
    to the rest of the dataset.  The examples flagged with this issue
    may be exactly duplicated, or lie atypically close together when
    represented as vectors (i.e. feature embeddings).


Number of examples with this issue: 4
Overall dataset quality in terms of this issue: 0.6160

Examples representing most severe instances of this issue:
     is_near_duplicate_issue  near_duplicate_score near_duplicate_sets  distance_to_nearest_neighbor
131                     True              0.000000               [123]                  0.000000e+00
123                     True              0.000000               [131]                  0.000000e+00
129                     True              0.000002               [130]                  4.463180e-07
130                     True              0.000002               [129]                  4.463180e-07
51                     False              0.161148                  []                  3.859087e-02
Functionality 4: Adding a custom IssueManager#
Datalab detects pre-defined types of issues for you in one line of code: find_issues(). What if you want to check for other custom types of issues along with these pre-defined types, all within the same line of code?
All issue types in Datalab are subclasses of cleanlab’s IssueManager class. To register a custom issue type for use with Datalab, simply also make it a subclass of IssueManager.
The necessary members to implement in the subclass are:
A class variable called
issue_namethat acts as a unique identifier for the type of issue.An instance method called
find_issuesthat:Computes a quality score for each example in the dataset (between 0-1), in terms of how unlikely it is to be an issue.
Flags each example as an issue or not (may be based on thresholding the quality scores).
Combine these in a dataframe that is assigned to an
issuesattribute of theIssueManager.Define a summary score for the overall quality of entire dataset, in terms of this type of issue. Set this score as part of the
summaryattribute of theIssueManager.
To demonstrate this, we create an arbitrary issue type that checks the divisibility of an example’s index in the dataset by 13.
[15]:
from cleanlab.datalab.internal.issue_manager import IssueManager
from cleanlab.datalab.internal.issue_manager_factory import register


def scoring_function(idx: int, div: int = 13) -> float:
    if idx == 0:
        # Zero excluded from the divisibility check, gets the highest score
        return 1
    rem = idx % div
    inv_scale = idx // div
    if rem == 0:
        return 0.5 * (1 - np.exp(-0.1*(inv_scale-1)))
    else:
        return 1 - 0.49 * (1 - np.exp(-inv_scale**0.5))*rem/div


@register  # register this issue type for use with Datalab
class SuperstitionIssueManager(IssueManager):
    """A custom issue manager that keeps track of issue indices that
    are divisible by 13.
    """
    description: str = "Examples with indices that are divisible by 13 may be unlucky."  # Optional
    issue_name: str = "superstition"

    def find_issues(self, div=13, **_) -> None:
        ids = self.datalab.issues.index.to_series()
        issues_mask = ids.apply(lambda idx: idx % div == 0 and idx != 0)
        scores = ids.apply(lambda idx: scoring_function(idx, div))
        self.issues = pd.DataFrame(
            {
                f"is_{self.issue_name}_issue": issues_mask,
                self.issue_score_key: scores,
            },
        )
        summary_score = 1 - sum(issues_mask) / len(issues_mask)
        self.summary = self.make_summary(score = summary_score)
Once registered, this IssueManager will perform custom issue checks when find_issues is called on a Datalab instance.
As our Datalab instance here already has results from the outlier and near duplicate checks, we perform the custom issue check separately.
[16]:
lab.find_issues(issue_types={"superstition": {}})
lab.report()
Finding superstition issues ...

Audit complete. 32 issues found in the dataset.
Dataset Information: num_examples: 132, num_classes: 3

Here is a summary of various issues found in your data:

    issue_type  num_issues
         label          11
  superstition          10
       outlier           7
near_duplicate           4

Learn about each issue: https://docs.cleanlab.ai/stable/cleanlab/datalab/guide/issue_type_description.html
See which examples in your dataset exhibit each issue via: `datalab.get_issues(<ISSUE_NAME>)`

Data indices corresponding to top examples of each issue are shown below.


----------------------- label issues -----------------------

About this issue:
        Examples whose given label is estimated to be potentially incorrect
    (e.g. due to annotation error) are flagged as having label issues.


Number of examples with this issue: 11
Overall dataset quality in terms of this issue: 0.9318

Examples representing most severe instances of this issue:
     is_label_issue  label_score given_label predicted_label
77             True     0.006940        high             mid
7              True     0.007830         low             mid
40             True     0.014828         mid             low
107            True     0.021241        high             mid
120            True     0.026407        high             mid


------------------- superstition issues --------------------

About this issue:
        Examples with indices that are divisible by 13 may be unlucky.

Number of examples with this issue: 10
Overall dataset quality in terms of this issue: 0.9242

Examples representing most severe instances of this issue:
    is_superstition_issue  superstition_score
13                   True            0.000000
26                   True            0.047581
39                   True            0.090635
52                   True            0.129591
65                   True            0.164840


---------------------- outlier issues ----------------------

About this issue:
        Examples that are very different from the rest of the dataset
    (i.e. potentially out-of-distribution or rare/anomalous instances).


Number of examples with this issue: 7
Overall dataset quality in terms of this issue: 0.3453

Examples representing most severe instances of this issue:
     is_outlier_issue  outlier_score
126              True       0.029542
130              True       0.031182
129              True       0.031182
128              True       0.057961
127              True       0.058244


------------------ near_duplicate issues -------------------

About this issue:
        A (near) duplicate issue refers to two or more examples in
    a dataset that are extremely similar to each other, relative
    to the rest of the dataset.  The examples flagged with this issue
    may be exactly duplicated, or lie atypically close together when
    represented as vectors (i.e. feature embeddings).


Number of examples with this issue: 4
Overall dataset quality in terms of this issue: 0.6160

Examples representing most severe instances of this issue:
     is_near_duplicate_issue  near_duplicate_score near_duplicate_sets  distance_to_nearest_neighbor
131                     True              0.000000               [123]                  0.000000e+00
123                     True              0.000000               [131]                  0.000000e+00
129                     True              0.000002               [130]                  4.463180e-07
130                     True              0.000002               [129]                  4.463180e-07
51                     False              0.161148                  []                  3.859087e-02