Datalab Issue Types#
Types of issues Datalab can detect#
This page describes the various types of issues that Datalab can detect in a dataset. For each type of issue, we explain: what it says about your data if detected, why this matters, and what parameters you can optionally specify to control the detection of this issue.
In case you didn’t know: you can alternatively use Cleanlab Studio to detect the same data issues as this package, plus many more types of issues, all without having to do any Machine Learning (or even write any code).
Issue Name |
Default |
Column Name |
Required keyword arguments in |
|---|---|---|---|
Yes |
|
||
Yes |
|
||
Yes |
|
||
Yes |
|
||
Yes |
None [1] |
||
Yes |
( |
||
Yes |
|
||
No |
|
Notes
Issue Name |
Default |
Column Name |
Required keyword arguments in |
|---|---|---|---|
Yes |
|||
Yes |
|
||
Yes |
|
||
Yes |
|
||
Yes |
|
Notes
Issue Name |
Default |
Column Name |
Required keyword arguments in |
|---|---|---|---|
Yes |
|
||
Yes |
|
||
Yes |
|
||
Yes |
|
||
Yes |
|
Estimates for Each Issue Type#
Datalab produces three estimates for each type of issue (called say <ISSUE_NAME> here):
A numeric quality score
<ISSUE_NAME>_score(between 0 and 1) estimating how severe this issue is exhibited in each example from a dataset. Examples with higher scores are less likely to suffer from this issue. Access these via: theDatalab.issuesattribute or the methodDatalab.get_issues(<ISSUE_NAME>).A Boolean
is_<ISSUE_NAME>_issueflag for each example from a dataset. Examples where this has valueTrueare those estimated to exhibit this issue. Access these via: theDatalab.issuesattribute or the methodDatalab.get_issues(<ISSUE_NAME>).An overall dataset quality score (between 0 and 1), quantifying how severe this issue is overall across the entire dataset. Datasets with higher scores do not exhibit this issue as badly overall. Access these via: the
Datalab.issue_summaryattribute or the methodDatalab.get_issue_summary(<ISSUE_NAME>).
Example (for the outlier issue type)
issue_name = "outlier"  # how to reference the outlier issue type in code
issue_score = "outlier_score"  # name of column with quality scores for the outlier issue type, atypical datapoints receive lower scores
is_issue = "is_outlier_issue"  # name of Boolean column flagging which datapoints are considered outliers in the dataset
Dataset vs. data point level issues
Some issues are primarily about the overall dataset (e.g. non-IID, class imbalance, underperforming group), whereas others are primarily about individual examples (e.g. label issue, outlier, near duplicate, null, etc). The former issue types should be first investigated via the global score from Datalab.get_issue_summary, as the per-example results for such issues from Datalab.get_issues require more expertise to interpret.
Inputs to Datalab#
Datalab estimates various issues based on the four inputs below. Each input is optional, if you do not provide it, Datalab will skip checks for those types of issues that require this input.
label_name- a field in the dataset that the stores the annotated class for each example in a multi-class classification dataset.pred_probs- predicted class probabilities output by your trained model for each example in the dataset (these should be out-of-sample, eg. produced via cross-validation).features- numeric vector representations of the features for each example in the dataset. These may be embeddings from a (pre)trained model, or just a numerically-transformed version of the original data features.knn_graph- K nearest neighbor graph represented as a sparse matrix of dissimilarity values between examples in the dataset. If bothknn_graphandfeaturesare provided, theknn_graphtakes precedence, and if onlyfeaturesis provided, then aknn_graphis internally constructed based on the (either euclidean or cosine) distance between different examples’ features.
Label Issue#
Examples whose given label is estimated to be potentially incorrect (e.g. due to annotation error) are flagged as having label issues. Datalab estimates which examples appear mislabeled as well as a numeric label quality score for each, which quantifies the likelihood that an example is correctly labeled.
For now, Datalab can only detect label issues in multi-class classification datasets, regression datasets, and multi-label classification datasets. The cleanlab library has alternative methods you can use to detect label issues in other types of datasets (multi-annotator, token classification, etc.).
Label issues are calculated based on provided pred_probs from a trained model. If you do not provide this argument, but you do provide features, then a K Nearest Neighbor model will be fit to produce pred_probs based on your features. Otherwise if neither pred_probs nor features is provided, then this type of issue will not be considered.
For the most accurate results, provide out-of-sample pred_probs which can be obtained for a dataset via cross-validation.
Having mislabeled examples in your dataset may hamper the performance of supervised learning models you train on this data. For evaluating models or performing other types of data analytics, mislabeled examples may lead you to draw incorrect conclusions. To handle mislabeled examples, you can either filter out the data with label issues or try to correct their labels.
Learn more about the method used to detect label issues in our paper: Confident Learning: Estimating Uncertainty in Dataset Labels
Some metadata about label issues is stored in the issues attribute of the Datalab object.
Let’s look at one way to access this information.
lab.get_issues("label").sort_values("label_score").head(5)
The output will look something like this:
    is_label_issue  label_score  given_label  predicted_label
97            True     0.064045            0                2
58           False     0.680894            2                2
41           False     0.746043            0                0
4            False     0.794894            2                2
98           False     0.802911            1                1
is_label_issue#
A boolean column that flags examples with label issues.
If True, the example is estimated to have a label issue.
If False, the example is estimated to not have a label issue.
label_score#
A numeric column that gives the label quality score for each example. The score lies between 0 and 1. The lower the score, the less likely the given label is to be correct.
given_label#
A column of the actual labels as provided in the original dataset.
predicted_label#
A column of the predicted labels for each example. This column may contain different labels than the given label, especially when the example is estimated to have a label issue or when a model predicts a different label than the given label.
Tip
This type of issue has the issue name "label".
Run a check for this particular kind of issue by calling Datalab.find_issues() like so:
# `lab` is a Datalab instance
lab.find_issues(..., issue_types = {"label": {}})
Outlier Issue#
Examples that are very different from the rest of the dataset (i.e. potentially out-of-distribution or rare/anomalous instances).
Outlier issues are calculated based on provided features , knn_graph , or pred_probs.
If you do not provide one of these arguments, this type of issue will not be considered.
This article describes how outlier issues are detected in a dataset: https://cleanlab.ai/blog/outlier-detection/.
When based on features or knn_graph, the outlier quality of each example is scored inversely proportional to its distance to its K nearest neighbors in the dataset.
When based on pred_probs, the outlier quality of each example is scored inversely proportional to the uncertainty in its prediction.
Modeling data with outliers may have unexpected consequences. Closely inspect them and consider removing some outliers that may be negatively affecting your models.
Learn more about the methods used to detect outliers in our article: Out-of-Distribution Detection via Embeddings or Predictions
Some metadata about outlier issues is stored in the issues attribute of the Datalab object.
Let’s look at one way to access this information.
lab.get_issues("outlier").sort_values("outlier_score").head(5)
The output will look something like this:
    is_outlier_issue  outlier_score
98              True       0.011562
62             False       0.019657
22             False       0.035243
1              False       0.040907
42             False       0.056865
is_outlier_issue#
A boolean column, where True indicates that an example is identified as an outlier.
outlier_score#
A numeric column with scores between 0 and 1. A smaller value for an example indicates that it is less common or typical in the dataset, suggesting that it is more likely to be an outlier.
Tip
This type of issue has the issue name "outlier".
Run a check for this particular kind of issue by calling Datalab.find_issues() like so:
# `lab` is a Datalab instance
lab.find_issues(..., issue_types = {"outlier": {}})
(Near) Duplicate Issue#
A (near) duplicate issue refers to two or more examples in a dataset that are extremely similar to each other, relative to the rest of the dataset. The examples flagged with this issue may be exactly duplicated, or lie atypically close together when represented as vectors (i.e. feature embeddings). Near duplicated examples may record the same information with different:
Abbreviations, misspellings, typos, formatting, etc. in text data.
Compression formats, resolutions, or sampling rates in image, video, and audio data.
Minor variations which naturally occur in many types of data (e.g. translated versions of an image).
Near Duplicate issues are calculated based on provided features or knn_graph.
If you do not provide one of these arguments, this type of issue will not be considered.
Datalab defines near duplicates as those examples whose distance to their nearest neighbor (in the space of provided features) in the dataset is less than c * D, where 0 < c < 1 is a small constant, and D is the median (over the full dataset) of such distances between each example and its nearest neighbor.
Scoring the numeric quality of an example in terms of the near duplicate issue type is done proportionally to its distance to its nearest neighbor.
Including near-duplicate examples in a dataset may negatively impact a ML model’s generalization performance and lead to overfitting. In particular, it is questionable to include examples in a test dataset which are (nearly) duplicated in the corresponding training dataset. More generally, examples which happen to be duplicated can affect the final modeling results much more than other examples — so you should at least be aware of their presence.
Some metadata about near-duplicate issues is stored in the issues attribute of the Datalab object.
Let’s look at one way to access this information.
lab.get_issues("near_duplicate").sort_values("near_duplicate_score").head(5)
The output will look something like this:
    is_near_duplicate_issue  near_duplicate_score near_duplicate_sets distance_to_nearest_neighbor
36                     True              0.066009            [11, 80]                     0.003906
11                     True              0.066009                [36]                     0.003906
80                     True              0.093245                [36]                     0.005599
27                    False              0.156720                  []                     0.009751
72                    False              0.156720                  []                     0.009751
is_near_duplicate_issue#
A boolean column, where True indicates that an example is identified as either a near- or exact-duplicate of other examples in the dataset.
near_duplicate_score#
A numeric column with scores between 0 and 1. The lower the score, the more likely the example is to be a near-duplicate of another example in the dataset.
Exact duplicates are assigned a score of 0, while near-duplicates are assigned a score close to 0.
near_duplicate_sets#
A column of lists of integers. The i-th list contains the indices of examples that are considered near-duplicates of example i (not including example i).
distance_to_nearest_neighbor#
A numeric column that represents the distance between each example and its nearest neighbor in the dataset.
The distance is calculated based on the provided features or knn_graph, and is directly related to the near_duplicate_score.
A smaller distance indicates that the example is similar to another example in the dataset.
Tip
This type of issue has the issue name "near_duplicate".
Run a check for this particular kind of issue by calling Datalab.find_issues() like so:
# `lab` is a Datalab instance
lab.find_issues(..., issue_types = {"near_duplicate": {}})
Non-IID Issue#
Whether the overall dataset exhibits statistically significant violations of the IID assumption like: changepoints or shift, drift, autocorrelation, etc. The specific form of violation considered is whether the examples are ordered within the dataset such that almost adjacent examples tend to have more similar feature values. If you care about this check, do not first shuffle your dataset – this check is entirely based on the sequential order of your data. Learn more via our blog: https://cleanlab.ai/blog/non-iid-detection/
The Non-IID issue is detected based on provided features or knn_graph. If you do not provide one of these arguments, this type of issue will not be considered. While the Non-IID check produces per-example information, it is primarily about assessing the overall dataset rather than assessing individual examples. So pay more attention to the overall dataset Non-IID score obtained via Datalab.get_issue_summary("non_iid") than the per-example scores.
The Non-IID issue is really a dataset-level check, not a per-datapoint level check (either a dataset violates the IID assumption or it doesn’t). The per-datapoint scores returned for Non-IID issues merely highlight which datapoints you might focus on to better understand this dataset-level issue - there is not necessarily something specifically wrong with these specific datapoints.
Mathematically, the overall Non-IID score for the dataset is defined as the p-value of a statistical test for whether the distribution of index-gap values differs between group A vs. group B defined as follows. For a pair of examples in the dataset x1, x2, we define their index-gap as the distance between the indices of these examples in the ordering of the data (e.g. if x1 is the 10th example and x2 is the 100th example in the dataset, their index-gap is 90). We construct group A from pairs of examples which are amongst the K nearest neighbors of each other, where neighbors are defined based on the provided knn_graph or via distances in the space of the provided vector features . Group B is constructed from random pairs of examples in the dataset.
The Non-IID quality score for each example x is defined via a similarly computed p-value but with Group A constructed from the K nearest neighbors of x and Group B constructed from random examples from the dataset paired with x. Learn more about this method in our paper: Detecting Dataset Drift and Non-IID Sampling via k-Nearest Neighbors (or the associated blogpost).
The assumption that examples in a dataset are Independent and Identically Distributed (IID) is fundamental to proper modeling. Detecting all possible violations of the IID assumption is statistically impossible. This issue type only considers specific forms of violation where examples that tend to be closer together in the dataset ordering also tend to have more similar feature values. This includes scenarios where:
The underlying distribution from which examples stem is evolving/drifting over time (not identically distributed).
An example can influence the values of future examples in the dataset (not independent).
For datasets with low non-IID score, you should consider why your data are not IID and act accordingly. For example, if the data distribution is drifting over time, consider employing a time-based train/test split instead of a random partition. Note that shuffling the data ahead of time will ensure a good non-IID score, but this is not always a fix to the underlying problem (e.g. future deployment data may stem from a different distribution, or you may overlook the fact that examples influence each other). We thus recommend not shuffling your data to be able to diagnose this issue if it exists.
Some metadata about non-IID issues is stored in the issues attribute of the Datalab object.
Let’s look at one way to access this information.
lab.get_issues("non_iid").sort_values("non_iid_score").head(5)
The output will look something like this:
    is_non_iid_issue  non_iid_score
24             False       0.681458
37             False       0.804582
64             False       0.810646
80             False       0.815691
78             False       0.834293
is_non_iid_issue#
A boolean column, where True values indicate that the dataset exhibits statistically significant violations of the IID assumption.
If the overall dataset does not appear to be Non-IID (p-value > 0.05), then all entries in this column will be False.
If the dataset appears to be Non-IID (p-value < 0.05), then one entry will be True, specifically the example with the lowest non_iid_score.
We do not recommend interpreting the per-example boolean values, as the Non-IID check is more about the overall dataset.
non_iid_score#
A numeric column with scores between 0 and 1, containing the Non-IID quality scores for each example. Learn more via our blogpost.
Be cautious when interpreting the non-IID issue score for individual examples.
The dataset as a whole receives a p-value for our non-IID test (obtained via Datalab.get_issue_summary("non_iid")), which better indicates whether the dataset exhibits non-IID behavior.
When this p-value is low, you can use the per-example non-IID scores to identify which examples to look at for better understanding this non-IID behavior.
Tip
This type of issue has the issue name "non_iid".
Run a check for this particular kind of issue by calling Datalab.find_issues() like so:
# `lab` is a Datalab instance
lab.find_issues(..., issue_types = {"non_iid": {}})
Class Imbalance Issue#
Class imbalance is diagnosed just using the labels provided as part of the dataset. The overall class imbalance quality score of a dataset is the proportion of examples belonging to the rarest class q. If this proportion q falls below a threshold, then we say this dataset suffers from the class imbalance issue.
In a dataset identified as having class imbalance, the class imbalance quality score for each example is set equal to q if it is labeled as the rarest class, and is equal to 1 for all other examples.
Class imbalance in a dataset can lead to subpar model performance for the under-represented class. Consider collecting more data from the under-represented class, or at least take special care while modeling via techniques like over/under-sampling, SMOTE, asymmetric class weighting, etc.
This issue-type is more about the overall dataset vs. individual data points. If severe class imbalance is detected, Datalab will flag the individual data points from the minority class.
Some metadata about class imbalance issues is stored in the issues attribute of the Datalab object.
Let’s look at one way to access this information.
lab.get_issues("class_imbalance").sort_values("class_imbalance_score").head(5)
The output will look something like this:
    is_class_imbalance_issue  class_imbalance_score  given_label
27                     False                   0.28            2
72                     False                   0.28            2
75                     False                   0.28            2
33                     False                   0.28            2
68                     False                   0.28            2
is_class_imbalance_issue#
A boolean column, where True indicates which examples belong to the minority class (rarest class) in a classification dataset that exhibits severe class imbalance. If the dataset is not considered to have severe class imbalance (i.e. proportion of examples in the rarest class is not to small relative to the number of classes in the dataset), then all values will be False.
class_imbalance_score#
A numeric column with scores between 0 and 1. Any example belonging to the most under-represented class is assigned a score equal to the proportion of examples in the dataset belonging to that class. All other examples are assigned a score of 1. All examples sharing the same label also share the same score.
given_label#
A column of the actual labels as provided in the original dataset.
Tip
This type of issue has the issue name "class_imbalance".
Run a check for this particular kind of issue by calling Datalab.find_issues() like so:
# `lab` is a Datalab instance
lab.find_issues(..., issue_types = {"class_imbalance": {}})
Image-specific Issues#
Datalab can identify image-specific issues in datasets, such as images that are excessively dark or bright, blurry, lack detail, or have unusual sizes.
To detect these issues, simply specify the image_key argument in Datalab(), indicating the image column name in your dataset.
This functionality currently works only with Hugging Face datasets. You can convert other local dataset formats into a Hugging Face dataset by following this guide.
More information on these image-specific issues is available in the CleanVision package .
Spurious Correlations between image-specific properties and labels#
Based on the image properties discussed earlier, Datalab can also look for spurious correlations between image properties and the labels in the dataset. These are unintended relationships between irrelevant features in images and the given labels, which ML models may easily exploit during training without learning the relevant features. Once deployed, such models would consistently fail to generalize on unseen data where these spurious correlations most likely don’t hold.
Spurious correlations may arise in the dataset due to various reasons, such as:
Images for certain classes might be consistently captured under specific environmental conditions.
Preprocessing techniques applied to the data might introduce systematic differences across classes.
Objects of different classes may be systematically photographed in particular ways.
Spurious Correlations are checked for when Datalab is initialized for an image dataset with the image_key keyword argument,
after checking for Image-specific Issues where the image properties are computed.
Each image property (e.g. darkness/brightness) is assigned a label uncorrelatedness score for the entire dataset. The lower the score, the more strongly the property is correlated with the class labels, across images of the dataset. This score is mathematically defined as: 1 minus the relative accuracy improvement in predicting the labels based solely on this image property value (relative to always predicting the most common overall class).
Consider reviewing the relationship between images with high and low values of this property and the labels if the corresponding label uncorrelatedness score is low, because ML models trained on this dataset may latch onto the spurious correlation and fail to generalize.
This issue type is more about the overall dataset vs. individual data points and will only be highlighted by Datalab in its report, if any such troublesome image properties are found.
Metadata about spurious correlations is stored in the info attribute of the Datalab object.
It can be accessed like so:
lab.get_info("spurious_correlations")["correlations_df"]
The output will look something like this:
                     property         score
0                blurry_score          0.559
1                  dark_score          0.808
2                 light_score          0.723
3              odd_size_score          0.957
4      odd_aspect_ratio_score          0.835
5             grayscale_score          0.003  # Likely to be spuriously correlated with the labels
6       low_information_score          0.688
Warning
Note that the label uncorrelatedness scores are not stored in the issues attribute of Datalab.
property#
A categorical column that identifies specific image-related characteristics assessed for potential spurious correlations with the class labels. Each entry in this column represents a distinct property of the images, such as blurriness, darkness, or grayscale, which may or may not be correlated with the labels.
score#
A numeric column that gives the level of label uncorrelatedness for a given image-specific property. The score lies between 0 and 1. The lower the score for an image-property, the more correlated the image-property is with the given labels.
Tip
This type of issue has the issue name "spurious_correlations".
Run a check for this particular kind of issue by calling Datalab.find_issues() like so:
# `lab` is a Datalab instance
lab.find_issues(..., issue_types = {"spurious_correlations": {}})
Underperforming Group Issue#
An underperforming group refers to a cluster of similar examples (i.e. a slice) in the dataset for which the ML model predictions are poor. The examples in this underperforming group may have noisy labels or feature values, or the trained ML model may not have learned how to properly handle them (consider collecting more data from this subpopulation or up-weighting the existing data from this group).
This issue-type is more about the overall dataset vs. individual data points. If an underperforming group is detected, Datalab will flag the individual data points from this group.
Underperforming Group issues are detected based on one of:
provided
pred_probsandfeatures,provided
pred_probsandknn_graph, orprovided
pred_probsandcluster_ids. (This option is for advanced users, see the FAQ for more details.)
If you do not provide both these arguments, this type of issue will not be considered.
To find the underperforming group, Cleanlab clusters the data using the provided features and determines the cluster c with the lowest average model predictive performance. Model predictive performance is evaluated via the model’s self-confidence of the given labels, calculated using rank.get_self_confidence_for_each_label. Suppose the average predictive power across the full dataset is r and is q within a cluster of examples. This cluster is considered to be an underperforming group if q/r falls below a threshold. A dataset suffers from the Underperforming Group issue if there exists such a cluster within it.
The underperforming group quality score is equal to q/r for examples belonging to the underperforming group, and is equal to 1 for all other examples.
Advanced users: If you have pre-computed cluster assignments for each example in the dataset, you can pass them explicitly to Datalab.find_issues using the cluster_ids key in the issue_types dict argument. This is useful for tabular datasets where you want to group/slice the data based on a categorical column. An integer encoding of the categorical column can be passed as cluster assignments for finding the underperforming group, based on the data slices you define.
Some metadata about underperforming group issues is stored in the issues attribute of the Datalab object.
Let’s look at one way to access this information.
lab.get_issues("underperforming_group").sort_values("underperforming_group_score").head(5)
The output will look something like this:
    is_underperforming_group_issue  underperforming_group_score
0                            False                          1.0
72                           False                          1.0
71                           False                          1.0
70                           False                          1.0
69                           False                          1.0
is_underperforming_group_issue#
A boolean column, where True indicates which examples belong to the subgroup (i.e. cluster/slice) for which model predictions are significantly worse than for the rest of the dataset.
If there is no such underperforming subgroup detected, then all values will be False.
underperforming_group_score#
A numeric column with scores between 0 and 1. Only examples belonging to a detected underperforming group receive a score less than 1. Every example in the underperforming group shares the same score, which is the ratio of group’s label quality score vs. the mean label quality score across the dataset. The lower the score, the worse the model predictions are for this particular subgroup relative to the rest of the dataset.
Tip
This type of issue has the issue name "underperforming_group".
Run a check for this particular kind of issue by calling Datalab.find_issues() like so:
# `lab` is a Datalab instance
lab.find_issues(..., issue_types = {"underperforming_group": {}})
Null Issue#
Examples identified with the null issue correspond to rows that have null/missing values across all feature columns (i.e. the entire row is missing values).
Null issues are detected based on provided features. If you do not provide features, this type of issue will not be considered.
Each example’s null issue quality score equals the proportion of features values in this row that are not null/missing. The overall dataset null issue quality score equals the average of the individual examples’ quality scores.
Presence of null examples in the dataset can lead to errors when training ML models. It can also result in the model learning incorrect patterns due to the null values.
Some metadata about null issues is stored in the issues attribute of the Datalab object.
Let’s look at one way to access this information.
lab.get_issues("null").sort_values("null_score").head(5)
The output will look something like this:
    is_null_issue  null_score
0           False         1.0
72          False         1.0
71          False         1.0
70          False         1.0
69          False         1.0
is_null_issue#
A boolean column, where True indicates that an example is identified as having null/missing values across all feature columns.
Examples that just have a single non-null value across multiple feature columns are not flagged with this issue.
null_score#
A numeric column with scores between 0 and 1. The score represents the proportion of non-null (i.e. non-missing) values in each example. Lower scores indicate examples with more null/missing values.
Tip
This type of issue has the issue name "null".
Run a check for this particular kind of issue by calling Datalab.find_issues() like so:
# `lab` is a Datalab instance
lab.find_issues(..., issue_types = {"null": {}})
Data Valuation Issue#
The examples in the dataset with lowest data valuation scores contribute least to a trained ML model’s performance (those whose value falls below a threshold are flagged with this type of issue).
Data valuation issues can be detected based on provided features or a provided knn_graph (or one pre-computed during the computation of other issue types). If you do not provide one of these two arguments and there isn’t a knn_graph already stored in the Datalab object, this type of issue will not be considered.
The data valuation score is an approximate Data Shapley value, calculated based on the labels of the top k nearest neighbors of an example. The details of this KNN-Shapley value could be found in the papers: Efficient Task-Specific Data Valuation for Nearest Neighbor Algorithms and Scalability vs. Utility: Do We Have to Sacrifice One for the Other in Data Importance Quantification?.
Some metadata about data valuation issues is stored in the issues attribute of the Datalab object.
Let’s look at one way to access this information.
lab.get_issues("data_valuation").sort_values("data_valuation_score").head(5)
The output will look something like this:
    is_data_valuation_issue  data_valuation_score
39                    False                   0.5
32                    False                   0.5
98                    False                   0.5
6                     False                   0.5
7                     False                   0.5
is_data_valuation_issue#
A boolean column, where True indicates that an example does not appear to contribute positively to a model’s training performance.
data_valuation_score#
A numeric column with scores between 0 and 1. The score reflects how valuable each individual example is in terms of improving the performance of the ML model trained on this dataset. Examples with higher scores more positively influence the resulting model’s predictive performance, contributing to better learning. One would expect the model to get worse if many such examples were removed from its training dataset.
Tip
This type of issue has the issue name "data_valuation".
Run a check for this particular kind of issue by calling Datalab.find_issues() like so:
# `lab` is a Datalab instance
lab.find_issues(..., issue_types = {"data_valuation": {}})
Identifier Column Issue#
This issue type flags sequential numerical columns in the features of a dataset. A numerical sequential column is most likely an identifier column, which - in most cases - should not be used in training ML models. More formally, an identifier column is defined as a column i in features such that set(features[:,i]) = set(c, c+1, …, c+n) for some integer c, where n = num_rows of features. Note we don’t consider the ordering of the column in case the dataset was pre-shuffled.
If the condition is met in one or more columns, then we say this dataset has the identifier_column issue. The overall issue-summary-score is binary. The score equals 1 if the issue is present and 0 if the issue is not present.
The info attribute of Datalab shows the indices of the columns with the column_identifier issue.
Tip
This type of issue has the issue name "identifier_column".
Run a check for this particular kind of issue by calling Datalab.find_issues() like so:
# `lab` is a Datalab instance
lab.find_issues(..., issue_types = {"identifier_column": {}})
Optional Issue Parameters#
Here is the dict of possible (optional) parameter values that can be specified via the argument issue_types to Datalab.find_issues.
Optionally specify these to exert greater control over how issues are detected in your dataset.
Appropriate defaults are used for any parameters you do not specify, so no need to specify all of these!
possible_issue_types = {
    "label": label_kwargs, "outlier": outlier_kwargs,
    "near_duplicate": near_duplicate_kwargs, "non_iid": non_iid_kwargs,
    "class_imbalance": class_imbalance_kwargs, "underperforming_group": underperforming_group_kwargs,
    "null": null_kwargs, "data_valuation": data_valuation_kwargs,
    "identifier_column": identifier_column_kwargs,
}
where the possible kwargs dicts for each key are described in the sections below.
Label Issue Parameters#
label_kwargs = {
    "k": # number of nearest neighbors to consider when computing pred_probs from features,
    "health_summary_parameters": # dict of potential keyword arguments to method `dataset.health_summary()`,
    "clean_learning_kwargs": # dict of keyword arguments to constructor `CleanLearning()` including keys like: "find_label_issues_kwargs" or "label_quality_scores_kwargs",
    "thresholds": # `thresholds` argument to `CleanLearning.find_label_issues()`,
    "noise_matrix": # `noise_matrix` argument to `CleanLearning.find_label_issues()`,
    "inverse_noise_matrix": # `inverse_noise_matrix` argument to `CleanLearning.find_label_issues()`,
    "save_space": # `save_space` argument to `CleanLearning.find_label_issues()`,
    "clf_kwargs": # `clf_kwargs` argument to `CleanLearning.find_label_issues()`. Currently has no effect.,
    "validation_func": # `validation_func` argument to `CleanLearning.fit()`. Currently has no effect.,
}
Attention
health_summary_parameters and health_summary_kwargs can work in tandem to determine the arguments to be used in the call to dataset.health_summary.
Note
For more information, view the source code of: datalab.internal.issue_manager.label.LabelIssueManager.
Outlier Issue Parameters#
outlier_kwargs = {
    "threshold": # floating value between 0 and 1 that sets the sensitivity of the outlier detection algorithms, based on either features or pred_probs.
    "k": # integer representing the number of nearest neighbors for nearest neighbors search (passed as argument to `NearestNeighbors`), if necessary, Used with features,
    "t": # integer used to modulate the strength of the transformation from distances to scores that lie in the range [0, 1]. Used with features,
    "scaling_factor": # floating value used to normalize the distances before they are converted into scores. Used with features,
    "metric": # string or callable representing the distance metric used in nearest neighbors search (passed as argument to `NearestNeighbors`), if necessary, Used with features,
    "ood_kwargs": # dict of keyword arguments to constructor `OutOfDistribution()`{
            "params": {
                    # NOTE: Each of the following keyword arguments can also be provided outside "ood_kwargs"
                    "adjust_pred_probs": # `adjust_pred_probs` argument to constructor `OutOfDistribution()`. Used with pred_probs,
                    "method": # `method` argument to constructor `OutOfDistribution()`. Used with pred_probs,
                    "confident_thresholds": # `confident_thresholds` argument to constructor `OutOfDistribution()`. Used with pred_probs,
            },
    },
}
Note
For more information, view the source code of: datalab.internal.issue_manager.outlier.OutlierIssueManager.
Duplicate Issue Parameters#
near_duplicate_kwargs = {
    "metric": # string or callable representing the distance metric used in nearest neighbors search (passed as argument to `NearestNeighbors`), if necessary,
    "k": # integer representing the number of nearest neighbors for nearest neighbors search (passed as argument to `NearestNeighbors`), if necessary,
    "threshold": # `threshold` argument to constructor of `NearDuplicateIssueManager()`. Non-negative floating value that determines the maximum distance between two examples to be considered outliers, relative to the median distance to the nearest neighbors,
}
Attention
k does not affect the results of the (near) duplicate search algorithm. It only affects the construction of the knn graph, if necessary.
Note
For more information, view the source code of: datalab.internal.issue_manager.duplicate.NearDuplicateIssueManager.
Non-IID Issue Parameters#
non_iid_kwargs = {
    "metric": # `metric` argument to constructor of `NonIIDIssueManager`. String or callable for the distance metric used for nearest neighbors search if necessary. `metric` argument to constructor of `sklearn.neighbors.NearestNeighbors`,
    "k": # `k` argument to constructor of `NonIIDIssueManager`. Integer representing the number of nearest neighbors for nearest neighbors search if necessary. `n_neighbors` argument to constructor of `sklearn.neighbors.NearestNeighbors`,
    "num_permutations": # `num_permutations` argument to constructor of `NonIIDIssueManager`,
    "seed": # seed for numpy's random number generator (used for permutation tests),
    "significance_threshold": # `significance_threshold` argument to constructor of `NonIIDIssueManager`. Floating value between 0 and 1 that determines the overall signicance of non-IID issues found in the dataset.
}
Note
For more information, view the source code of: datalab.internal.issue_manager.noniid.NonIIDIssueManager.
Imbalance Issue Parameters#
class_imbalance_kwargs = {
    "threshold": # `threshold` argument to constructor of `ClassImbalanceIssueManager`. Non-negative floating value between 0 and 1 indicating the minimum fraction of samples of each class that are present in a dataset without class imbalance.
}
Note
For more information, view the source code of: datalab.internal.issue_manager.imbalance.ClassImbalanceIssueManager.
Underperforming Group Issue Parameters#
underperforming_group_kwargs = {
    # Constructor arguments for `UnderperformingGroupIssueManager`
    "threshold": # Non-negative floating value between 0 and 1 used for determinining group of points with low confidence.
    "metric": # String or callable for the distance metric used for nearest neighbors search if necessary. `metric` argument to constructor of `sklearn.neighbors.NearestNeighbors`.
    "k": # Integer representing the number of nearest neighbors for constructing the nearest neighbour graph. `n_neighbors` argument to constructor of `sklearn.neighbors.NearestNeighbors`.
    "min_cluster_samples": # Non-negative integer value specifying the minimum number of examples required for a cluster to be considered as the underperforming group. Used in `UnderperformingGroupIssueManager.filter_cluster_ids`.
    "clustering_kwargs": # Key-value pairs representing arguments for the constructor of the clustering algorithm class (e.g. `sklearn.cluster.DBSCAN`).

    # Argument for the find_issues() method of UnderperformingGroupIssueManager
    "cluster_ids": # A 1-D numpy array containing cluster labels for each sample in the dataset. If passed, these cluster labels are used for determining the underperforming group.
}
Note
For more information, view the source code of: datalab.internal.issue_manager.underperforming_group.UnderperformingGroupIssueManager.
For more information on generating cluster_ids for this issue manager, refer to this FAQ Section.
Null Issue Parameters#
null_kwargs = {}
Note
For more information, view the source code of: datalab.internal.issue_manager.null.NullIssueManager.
Data Valuation Issue Parameters#
data_valuation_kwargs = {
    "k": # Number of nearest neighbors used to calculate data valuation scores,
    "threshold": # Examples with scores below this  threshold will be flagged with a data valuation issue
}
Note
For more information, view the source code of: datalab.internal.issue_manager.data_valuation.DataValuationIssueManager.
Identifier Column Parameters#
identifier_column_kwargs = {}
Note
For more information, view the source code of: datalab.internal.issue_manager.identifier_column.IdentifierColumnIssueManager.
Image Issue Parameters#
To customize optional parameters for specific image issue types, you can provide a dictionary format corresponding to each image issue. The following codeblock demonstrates how to specify optional parameters for all image issues. However, it’s important to note that providing optional parameters for specific image issues is not mandatory. If no specific parameters are provided, defaults will be used for those issues.
image_issue_types_kwargs = {
    "dark": {"threshold": 0.32}, # `threshold` argument for dark issue type. Non-negative floating value between 0 and 1, lower value implies fewer samples will be marked as issue and vice versa.
    "light": {"threshold": 0.05}, # `threshold` argument for light issue type. Non-negative floating value between 0 and 1, lower value implies fewer samples will be marked as issue and vice versa.
    "blurry": {"threshold": 0.29}, # `threshold` argument for blurry issue type. Non-negative floating value between 0 and 1, lower value implies fewer samples will be marked as issue and vice versa.
    "low_information": {"threshold": 0.3}, # `threshold` argument for low_information issue type. Non-negative floating value between 0 and 1, lower value implies fewer samples will be marked as issue and vice versa.
    "odd_aspect_ratio": {"threshold": 0.35}, # `threshold` argument for odd_aspect_ratio issue type. Non-negative floating value between 0 and 1, lower value implies fewer samples will be marked as issue and vice versa.
    "odd_size": {"threshold": 10.0}, # `threshold` argument for odd_size issue type. Non-negative integer value between starting from 0, unlike other issues, here higher value implies fewer samples will be selected.
}
Note
For more information, view the cleanvision docs.
Spurious Correlations Issue Parameters#
spurious_correlations_kwargs = {
    "threshold": 0.3, # Non-negative floating value between 0 and 1, lower value implies fewer image properties may have a low enough label uncorrelatedness score to be marked as issue and vice versa.
}
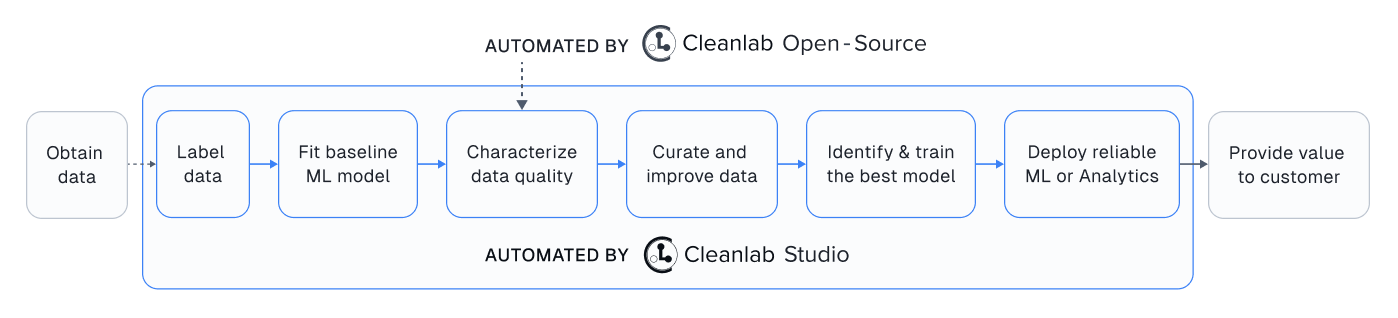
Cleanlab Studio (Easy Mode)#
Cleanlab Studio is a fully automated platform that can detect the same data issues as this package, as well as many more types of issues, all without you having to do any Machine Learning (or even write any code). Beyond being 100x faster to use and producing more useful results, Cleanlab Studio also provides an intelligent data correction interface for you to quickly fix the issues detected in your dataset (a single data scientist can fix millions of data points thanks to AI suggestions).
Cleanlab Studio offers a powerful AutoML system (with Foundation models) that is useful for more than improving data quality. With a few clicks, you can: find + fix issues in your dataset, identify the best type of ML model and train/tune it, and deploy this model to serve accurate predictions for new data. Also use the same AutoML to auto-label large datasets (a single user can label millions of data points thanks to powerful Foundation models). Try Cleanlab Studio for free!