Image Classification with PyTorch and Cleanlab#
This 5-minute quickstart tutorial demonstrates how to find potential label errors in image classification data. Here we use the MNIST dataset containing 70,000 images of handwritten digits from 0 to 9.
Overview of what we’ll do in this tutorial:
Build a simple PyTorch neural net and wrap it with skorch to make it scikit-learn compatible.
Use this model to compute out-of-sample predicted probabilities,
pred_probs, via cross-validation.Compute a list of potential label errors with cleanlab’s
find_label_issuesmethod.
1. Install the required dependencies#
You can use pip to install all packages required for this tutorial as follows:
!pip install matplotlib torch torchvision skorch
!pip install cleanlab
# Make sure to install the version corresponding to this tutorial
# E.g. if viewing master branch documentation:
#     !pip install git+https://github.com/cleanlab/cleanlab.git
Let’s first set some seeds for reproducibility.
[2]:
import numpy as np
import torch
import warnings

SEED = 123
np.random.seed(SEED)
torch.manual_seed(SEED)
torch.backends.cudnn.deterministic = True
torch.backends.cudnn.benchmark = False
torch.cuda.manual_seed_all(SEED)
warnings.filterwarnings("ignore", "Lazy modules are a new feature.*")
2. Fetch and scale the MNIST dataset#
[3]:
from sklearn.datasets import fetch_openml

mnist = fetch_openml("mnist_784")  # Fetch the MNIST dataset

X = mnist.data.astype("float32").to_numpy() # 2D array (images are flattened into 1D)
X /= 255.0  # Scale the features to the [0, 1] range
X = X.reshape(len(X), 1, 28, 28)  # reshape into [N, C, H, W] for PyTorch

y = mnist.target.astype("int64").to_numpy()  # 1D array of labels
Bringing Your Own Data (BYOD)?
Assign your data’s features to variable X and its labels to variable y instead.
Your classes (and entries of y) should be represented as integer indices 0, 1, …, num_classes - 1.
3. Define a classification model#
Here, we define a simple neural network with PyTorch.
[4]:
from torch import nn

class ClassifierModule(nn.Module):
    def __init__(self):
        super().__init__()

        self.cnn = nn.Sequential(
            nn.Conv2d(1, 6, 3),
            nn.ReLU(),
            nn.BatchNorm2d(6),
            nn.MaxPool2d(kernel_size=2, stride=2),
            nn.Conv2d(6, 16, 3),
            nn.ReLU(),
            nn.BatchNorm2d(16),
            nn.MaxPool2d(kernel_size=2, stride=2),
        )
        self.out = nn.Sequential(
            nn.Flatten(),
            nn.LazyLinear(128),
            nn.ReLU(),
            nn.Linear(128, 10),
            nn.Softmax(dim=-1),
        )

    def forward(self, X):
        X = self.cnn(X)
        X = self.out(X)
        return X
4. Ensure your classifier is scikit-learn compatible#
As some cleanlab features require scikit-learn compatibility, we adapt the above PyTorch neural net accordingly. skorch is a convenient package that helps with this. Alternatively, you can also easily wrap an arbitrary model to be scikit-learn compatible as demonstrated here.
[5]:
from skorch import NeuralNetClassifier

model_skorch = NeuralNetClassifier(ClassifierModule)
5. Compute out-of-sample predicted probabilities#
If we’d like cleanlab to identify potential label errors in the whole dataset and not just the training set, we can consider using the entire dataset when computing the out-of-sample predicted probabilities, pred_probs, via cross-validation.
[6]:
from sklearn.model_selection import cross_val_predict

num_crossval_folds = 3  # for efficiency; values like 5 or 10 will generally work better
pred_probs = cross_val_predict(
    model_skorch,
    X,
    y,
    cv=num_crossval_folds,
    method="predict_proba",
)
  epoch    train_loss    valid_acc    valid_loss     dur
-------  ------------  -----------  ------------  ------
      1        0.6908       0.9136        0.3099  3.8333
      2        0.2112       0.9412        0.1999  3.5987
      3        0.1521       0.9514        0.1575  3.7921
      4        0.1240       0.9593        0.1332  3.8446
      5        0.1066       0.9634        0.1178  3.8152
      6        0.0948       0.9661        0.1072  3.6773
      7        0.0860       0.9683        0.0995  3.7374
      8        0.0792       0.9703        0.0933  3.8420
      9        0.0737       0.9724        0.0887  4.0832
     10        0.0691       0.9736        0.0848  3.6481
  epoch    train_loss    valid_acc    valid_loss     dur
-------  ------------  -----------  ------------  ------
      1        0.7043       0.9249        0.2786  3.7278
      2        0.1907       0.9465        0.1817  3.6730
      3        0.1355       0.9561        0.1476  3.6867
      4        0.1100       0.9616        0.1290  3.6845
      5        0.0943       0.9644        0.1168  3.7497
      6        0.0834       0.9685        0.1079  3.7851
      7        0.0752       0.9701        0.1015  3.7732
      8        0.0687       0.9711        0.0965  3.6264
      9        0.0634       0.9724        0.0921  3.6344
     10        0.0589       0.9734        0.0889  3.6933
  epoch    train_loss    valid_acc    valid_loss     dur
-------  ------------  -----------  ------------  ------
      1        0.7931       0.9115        0.3373  3.6931
      2        0.2282       0.9487        0.1950  3.6519
      3        0.1533       0.9589        0.1499  3.7697
      4        0.1218       0.9642        0.1277  3.7316
      5        0.1032       0.9680        0.1136  3.7115
      6        0.0904       0.9704        0.1038  3.6836
      7        0.0809       0.9731        0.0963  4.1410
      8        0.0736       0.9745        0.0905  3.7695
      9        0.0678       0.9762        0.0859  3.8166
     10        0.0630       0.9766        0.0826  3.8172
An additional benefit of cross-validation is that it facilitates more reliable evaluation of our model than a single training/validation split.
[7]:
from sklearn.metrics import accuracy_score

predicted_labels = pred_probs.argmax(axis=1)
acc = accuracy_score(y, predicted_labels)
print(f"Cross-validated estimate of accuracy on held-out data: {acc}")
Cross-validated estimate of accuracy on held-out data: 0.9752142857142857
6. Use cleanlab to find label issues#
Based on the given labels and out-of-sample predicted probabilities, cleanlab can quickly help us identify label issues in our dataset. Here we request that the indices of the identified label issues be sorted by cleanlab’s self-confidence score, which measures the quality of each given label via the probability assigned to it in our model’s prediction.
[8]:
from cleanlab.filter import find_label_issues

ranked_label_issues = find_label_issues(
    y,
    pred_probs,
    return_indices_ranked_by="self_confidence",
)

print(f"Cleanlab found {len(ranked_label_issues)} label issues.")
print(f"Top 15 most likely label errors: \n {ranked_label_issues[:15]}")
Cleanlab found 145 label issues.
Top 15 most likely label errors:
 [59915 24798 19124 53216  2720 59701 50340  7010 40976 16376 23824   500
 44484  8729 31134]
ranked_label_issues is a list of indices corresponding to examples that are worth inspecting more closely. To help visualize specific examples, we define a plot_examples function (can skip these details).
Below is the code used for plotting.
# Note: This pulldown content is for docs.cleanlab.ai, if running on local Jupyter or Colab, please ignore it.

import matplotlib.pyplot as plt

def plot_examples(id_iter, nrows=1, ncols=1):
    for count, id in enumerate(id_iter):
        plt.subplot(nrows, ncols, count + 1)
        plt.imshow(X[id].reshape(28, 28), cmap="gray")
        plt.title(f"id: {id} \n label: {y[id]}")
        plt.axis("off")

    plt.tight_layout(h_pad=2.0)
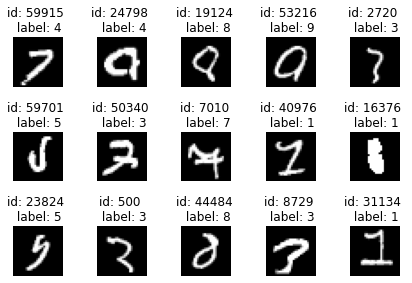
Let’s look at the top 15 examples cleanlab thinks are most likely to be incorrectly labeled. We can see a few label errors and odd edge cases. Feel free to change the values below to display more/fewer examples.
[10]:
plot_examples(ranked_label_issues[range(15)], 3, 5)
Let’s zoom into some specific examples from the above set:
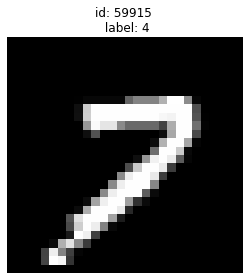
Given label is 4 but looks more like a 7:
[11]:
plot_examples([59915])
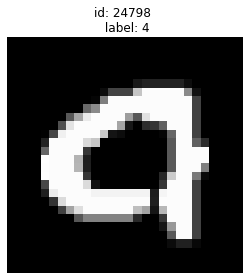
Given label is 4 but also looks like 9:
[12]:
plot_examples([24798])
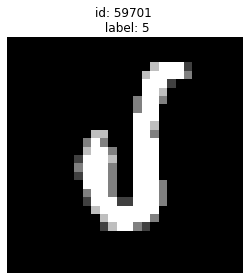
A very odd looking 5:
[13]:
plot_examples([59701])
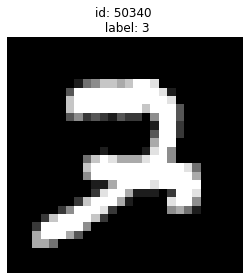
Given label is 3 but could be a 7:
[14]:
plot_examples([50340])
cleanlab has shortlisted the most likely label errors to speed up your data cleaning process. With this list, you can decide whether to fix label issues or prune some of these examples from the dataset.
You can see that even widely-used datasets like MNIST contain problematic labels. Never blindly trust your data! You should always check it for potential issues, many of which can be easily identified by cleanlab.